


Landlords/Investors are in constant need of information. Property managers and operators always have to be prepared for questions around:
- How much revenue am I getting this month?
- What is the list of my expenses?
- What is the increase in profit for a given period?
- How many tickets have been raised for my property?
- Are all of my properties occupied?
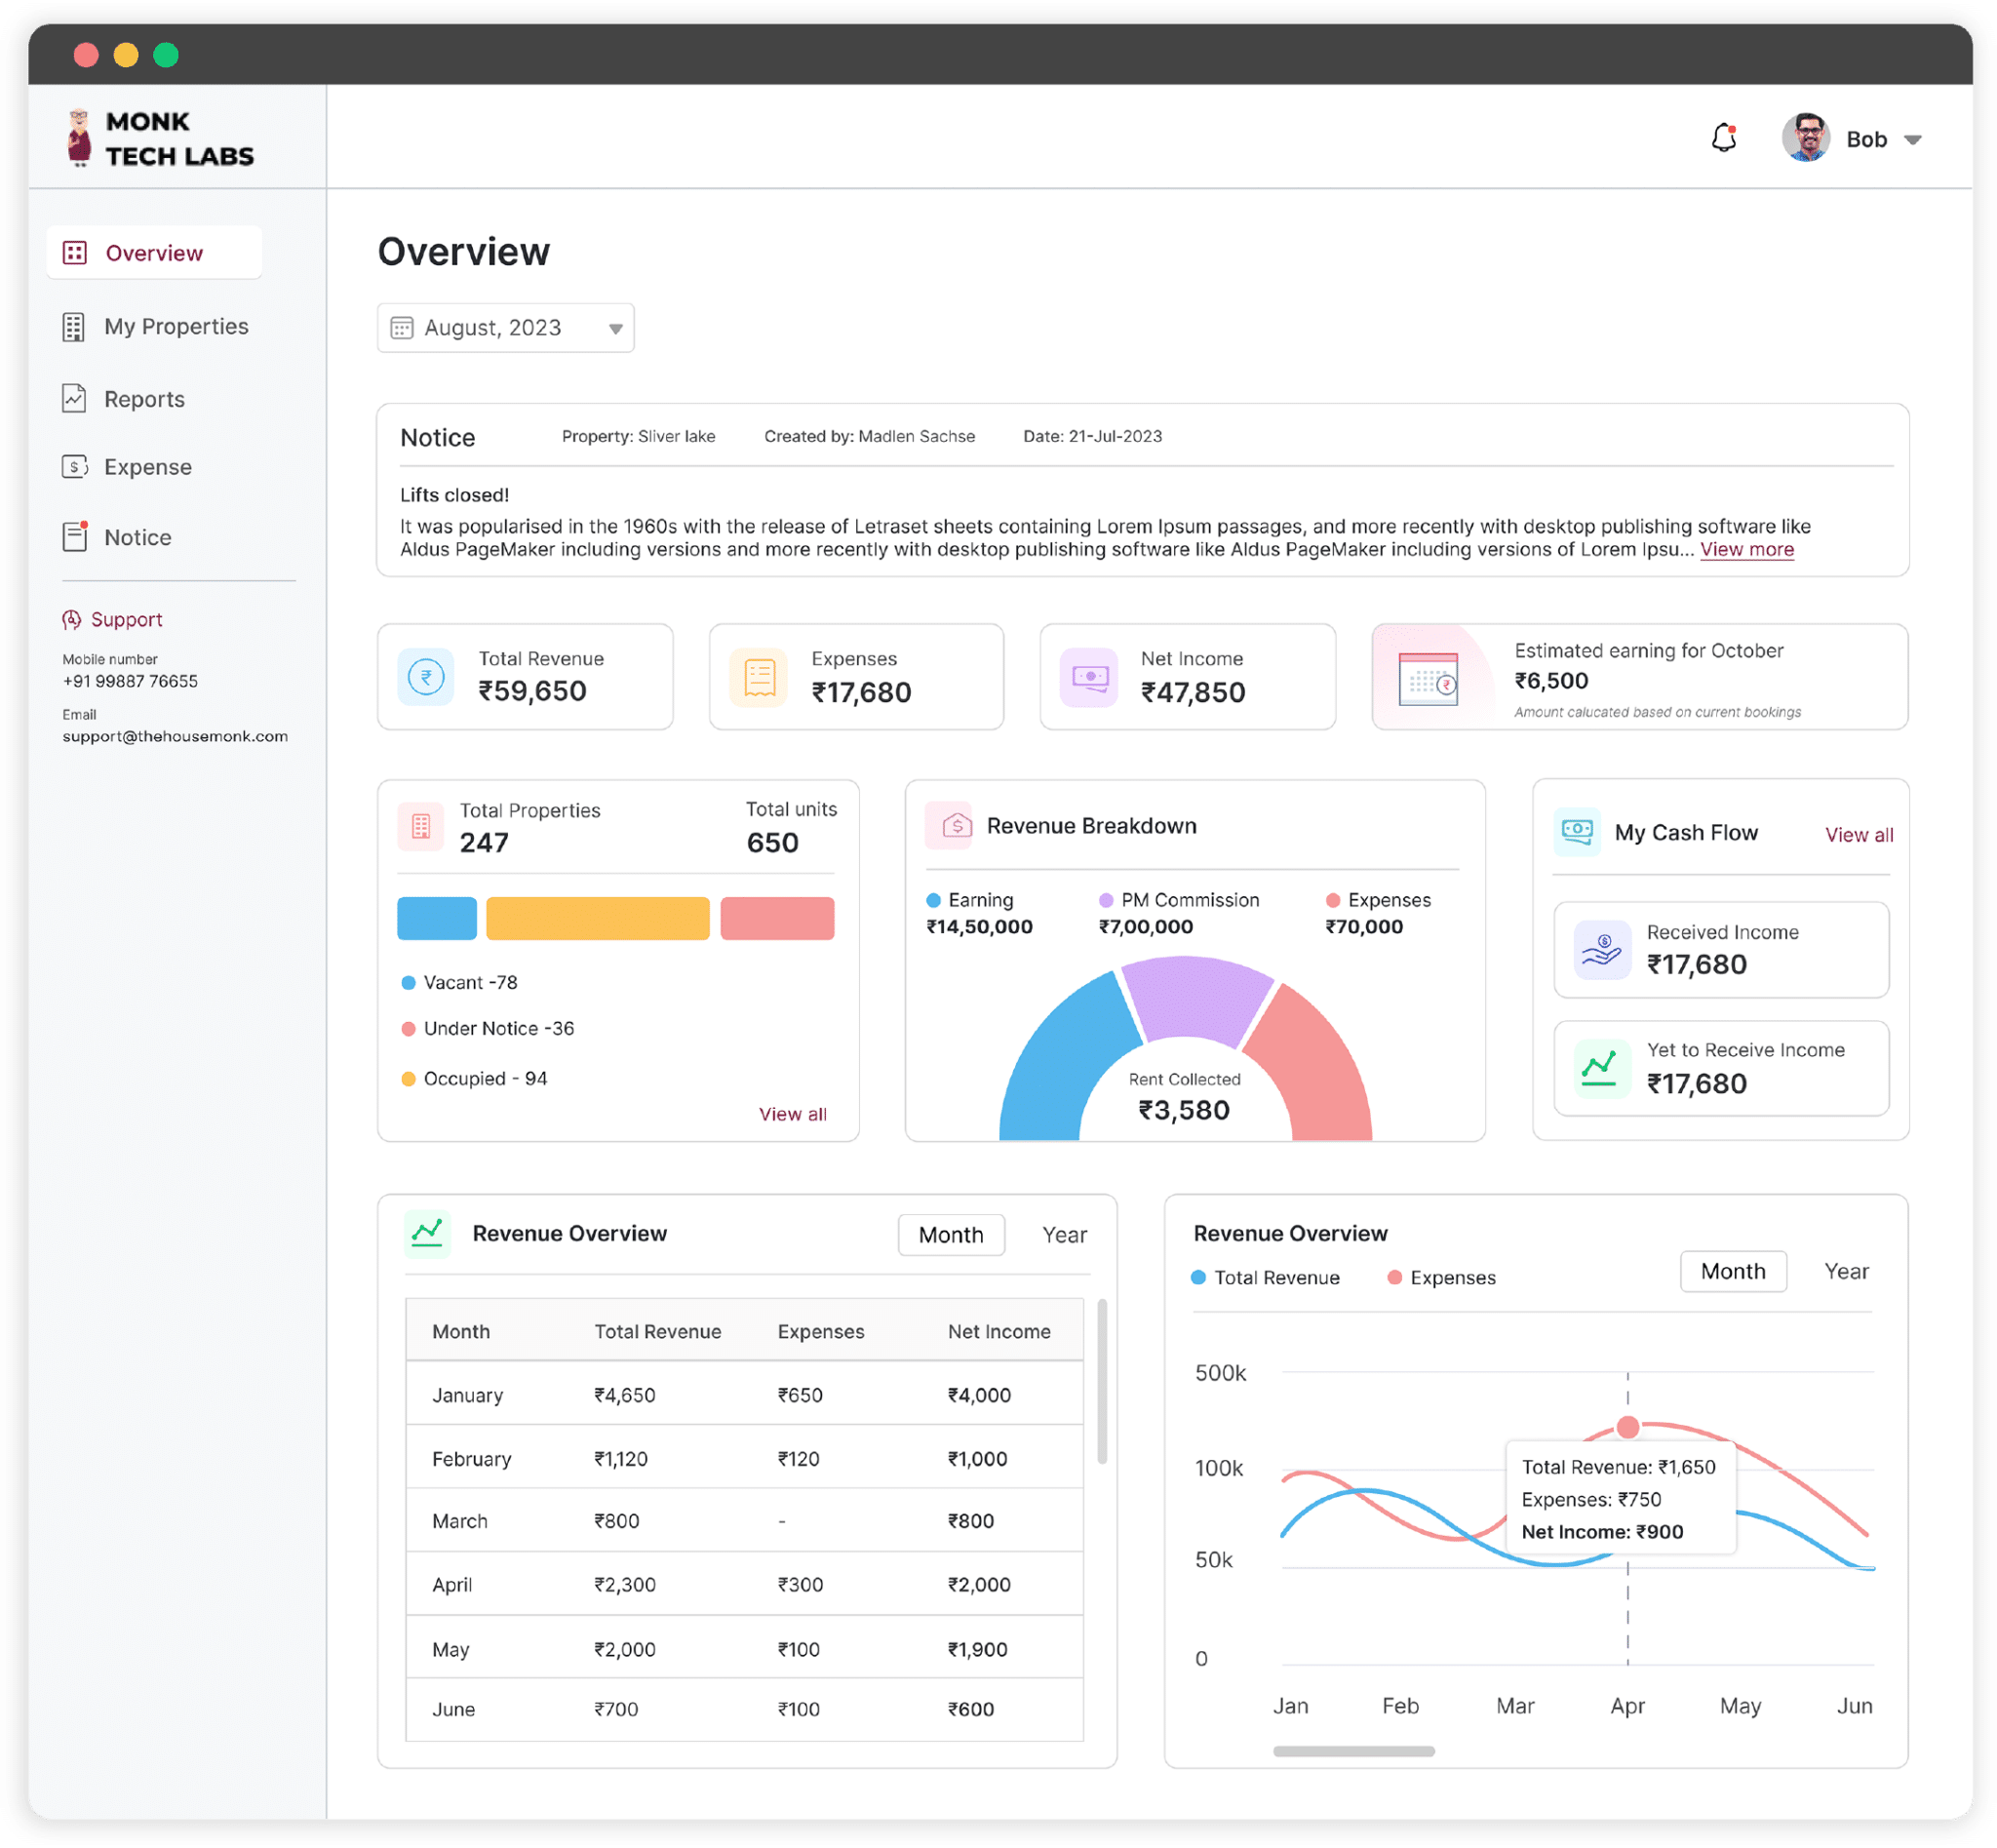
When needs meet reason, there needs to be a solution. This marks the genesis of our Landlord/Investor Dashboard – A data-driven web portal that allows landlords/owners/investors to access information around revenue, expenses, net income, expected revenue, cash flow and tickets raised at the property level, this is an all-inclusive, end-to-end solution for both property managers and landlords and investors.
Was there a need for this Dedicated Dashboard?
In our opinion, this was an absolute need. But to elaborate, we testify two reasons as the core for building this dashboard.
- Increased strain and workload for the Property Manager: In addition to the day-to-day tasks of a property manager/operator, the constant back-to-back messages and calls between landlords/owners/investors around a property’s finances, and tickets make it not only stressful but also add to the strain.
- Manual workflow: Currently, property managers and operators need to create timely manual reports around income, expenses, profits and operations. This is a time-consuming, monotonous and difficult task.

The current workflow that is followed by Property Managers and Operators
Consider the following list of items that need to be accounted for:
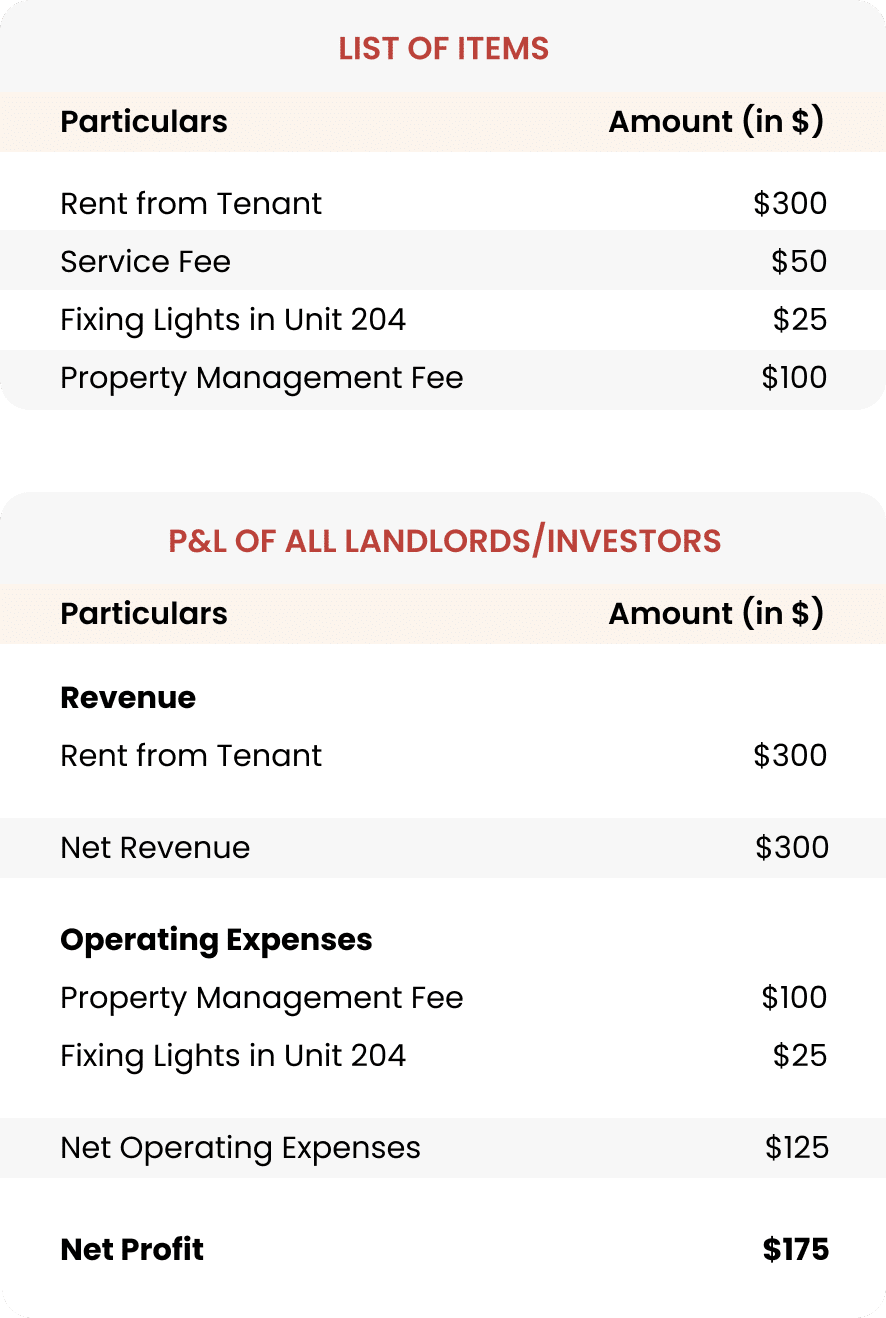
A property manager will need to account for these individually, create reports and share it with the landlords/owners/investors. Not the most ideal.
Now that the why is established, we would love to cover how we are addressing these problems.
How are our solutions making a difference to the problems around Landlord Dashboard?
We can summarize our solution in 2 quick points, they are:
- Dedicated Dashboard focussed with a focus on Landlords: This eliminates the need for constant back and forth between the property managers and the owners with the ability to download reports. This includes all information about financials and operations.
- Automated Workflow that does not require double entry: Creating Bills and Expenses on Godview automatically records Revenue for the owner and registering invoices and receipts records expenses on the Landlord/Investor Dashboard.
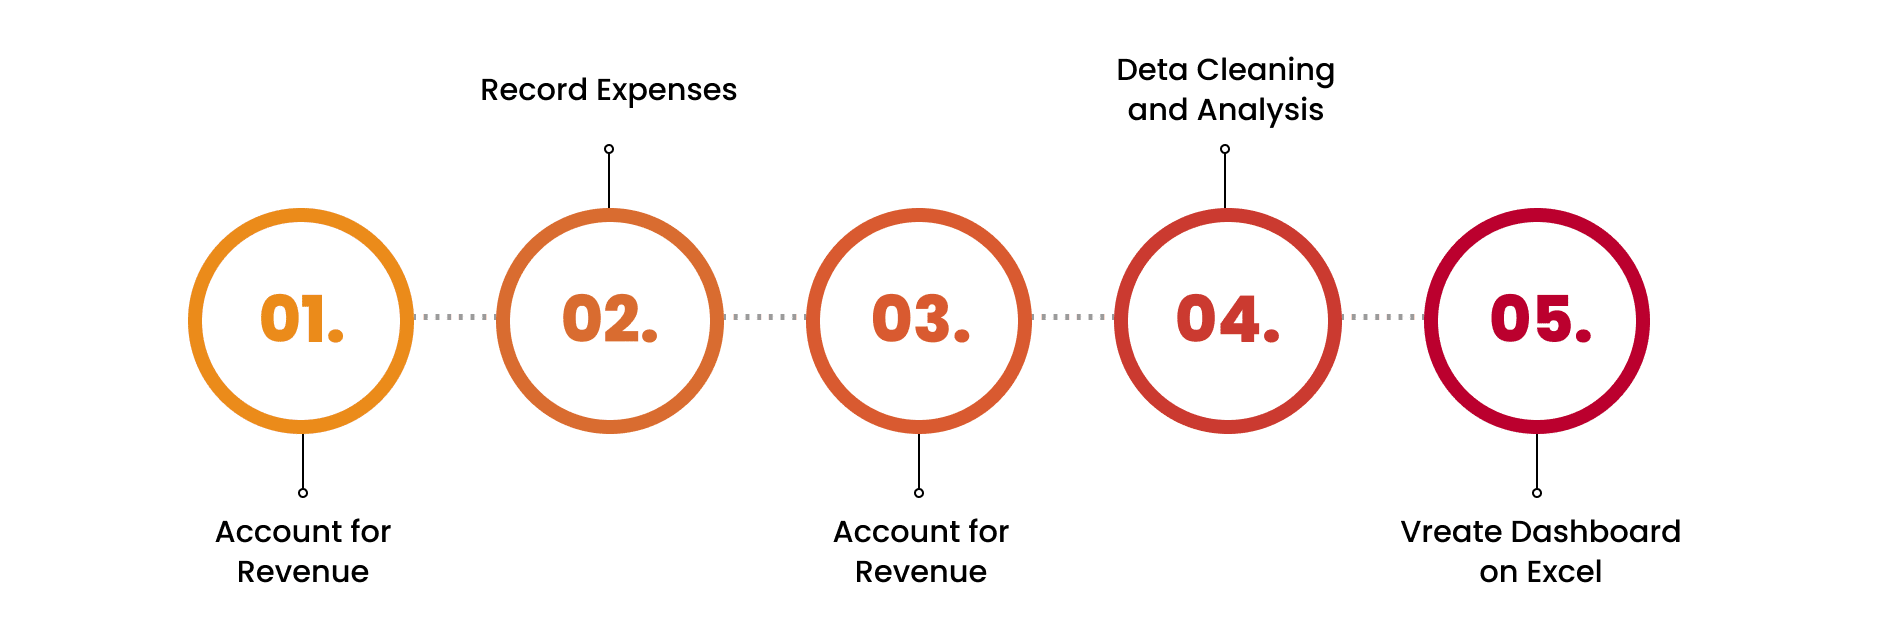
Consider the following list of items that need to be accounted for:
Recording Rent from the tenant as an expense to send to the owner
Recording Property management fees as an Income for the Operator and as an Expense for the Owner
Recording Service fees as an Income for the Operator
Recording Repair fees for the operator
Display on Landlord Dashboard
Some salient features we bring to the table:
- Graphical Representation of all data to ensure visual representation of data
- Insight into notices, tickets
Notices created on Godview that is seen on the Landlord portal
Tickets created on Godview visible on the Investor Portal
- Line-item wise expenses
- Ability to download a variety of reports
Landlords and investors are particularly interested in seeing stats, and figures, numbers and it is not feasible to make these reports from time to time considering schedules, day-to-day tasks and meetings. In the world of automation and technology, real estate professionals should carry on with their day with data automation in place.
MTL’s dashboard, we believe is the solution to this problem.


One Response
http://pin-up.diy/# пин ап казино